With this program for Windows it is easy to gather (digitize) data points and coordinates of a plot or graph out of a JPG, GIF, BMP, Clipboard picture or photo (e.g. from a presentation, a publication or a journal). You get the data in text form which you can use in any program such as Excel, Origin, ... You just need a scalebar in the image
It is also possible to use this program as a distance measure in pictures with a scale bar such as AFM or SEM images. The special feature tilting correction enables height measurements in SEM images (if the tilting angle is known).
At the beginning you define the starting and endpoints of the axis in the picture. Then you klick on your graph to get the data points out of it.
Using the program, you can compare your measurements with results published by others. For that you need to extract the data points from their picture since you do not have the original data as text.
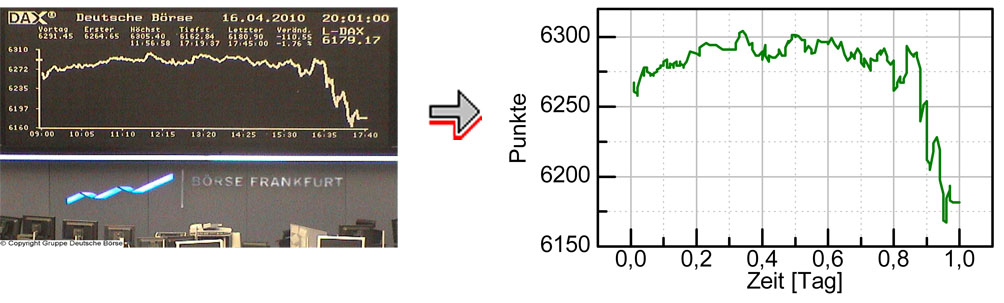
Another example where to use the program is shown below: Say you have an image from the stock market and want to get the real numbers to work with them and to make a calculation.
In this example we have a picture from the german stock index DAX, which is transformed into datapoints which you can use in Excel or other programs to make calculations or replot the data. Picture by curtesey of www.boerse-frankfurt.de. If you want to see a live image of the DAX, please klick here.
Features
Loading a picture into the program is done by drag & drop of
JPG, GIF,
BMP files or files from the
windows clipboard (by Ctrl + v).
To obtain the datapoints from such a graph, you can either repeatedly click on the curve or use the keyboard, which gives you a very accurate positioning of the cursor and well defined data points. (Picture: W. Smirnov [1])
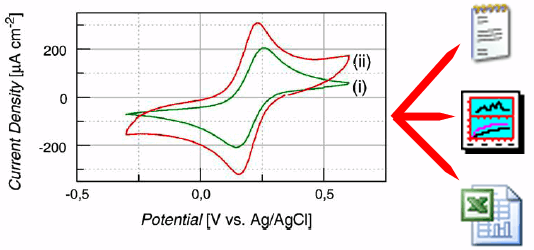
You can use the gathered data e.g. in Excell or Origin to make calculations with them or replot them in combination with other graphs.
It is especially helpful when you want to compare your own data with the
data from other groups. In this case mostly you dont have thier measured
points, but rather a pdf or a
picture from their publication or presentation. From this pdf or
ppt you can easily copy a graph and
paste it to Digitize Plot To Data to get the data points.
Work Flow
First of all you have to define the axis or a scale bar in the picture. You do this either by using the mouse or the keyboard, with which an exact definition of the axis is possible. It is also possible to select whether or not the axis in the image are logarithmic. Then you can click on the picture and each click gives you data points as text.
Simplified Axis Definition by two clicks
After clicking on the icon, the program expects two clicks from you: the upper most point of the y-axis and the right most point of the x-axis:
Given Scalebar
Given an image with just one scale (scalebar) you are able to measure distances with Digitize Plot to Data. This is useful in e.g.
SEM or AFM images.
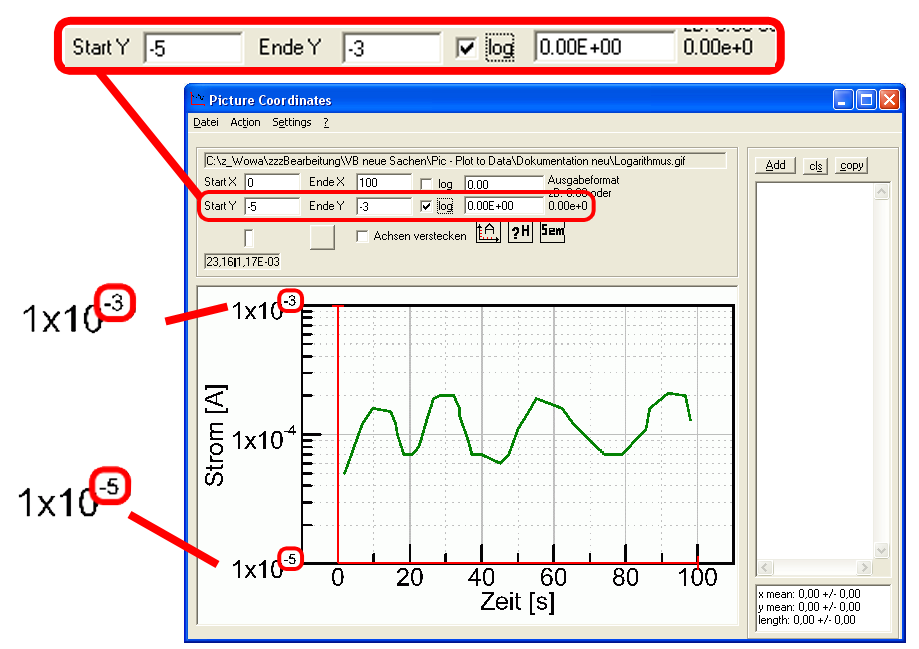
Logarithmic Axis
With Digitize Plot To Data you can also get datapoints from a picture with logarithmic axes.
To use this feature, you just tick the checkbox and write down the powers in the textboxes. E.g. for an axis ranging from 10-5 to 10-3, type in -5 and -3.
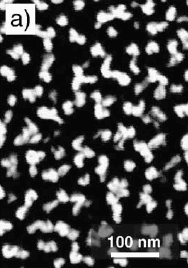
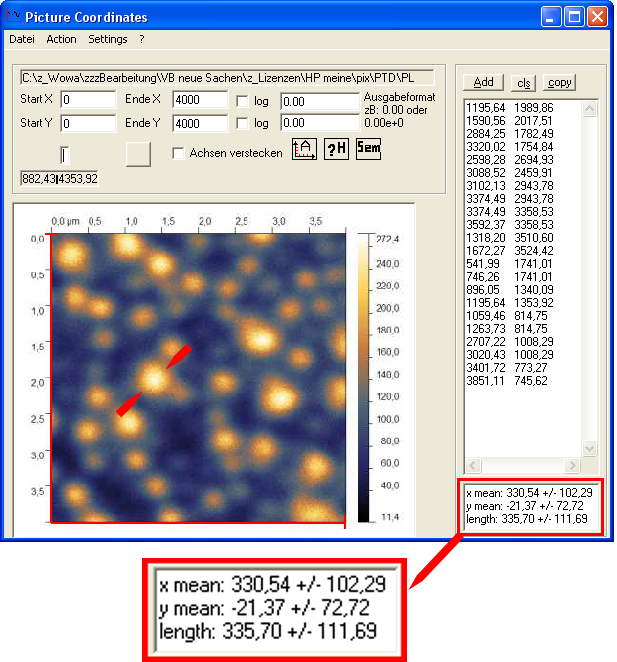
Distances and Sizes
With Digitize Plot to Data you can easily determine the
size of particles or their distances in e.g. an
SEM or an
AFM image, where just one scale is given.
After each two clicks on the picture, the program calculates the distance between those to clicks
depending on the scale bar. Digitize Plot to Data also calculates the mean distance with it's standard deviation.
In this photolumineszenz picture, the size of the light guides (diameter) is determined too be 335 +/- 112 nm (Mean +/- StDev).
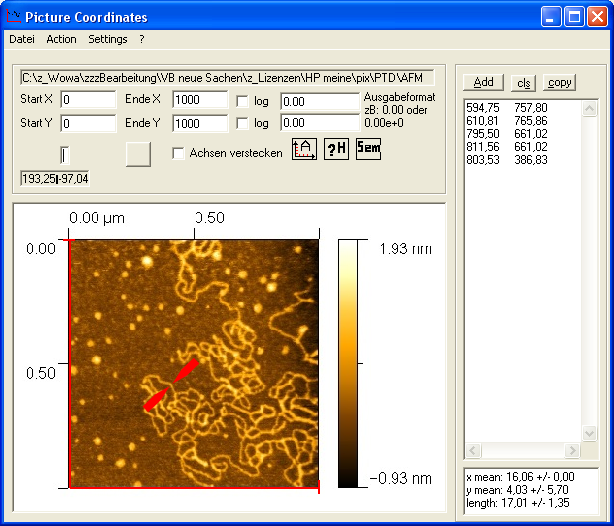
The topography of a single stranded DNA (SS-DNA) is imaged in the AFM picture here.
With Digitize Plot To Data it is easily possible to obtain the thickness of this DNA: 17 +/- 1 nm.
With Digitize Plot To Data you can easily obtain the mean size/ diameter or separation of this imaged particles. (Picture: W. Smirnov [2])
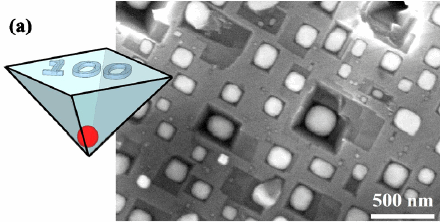
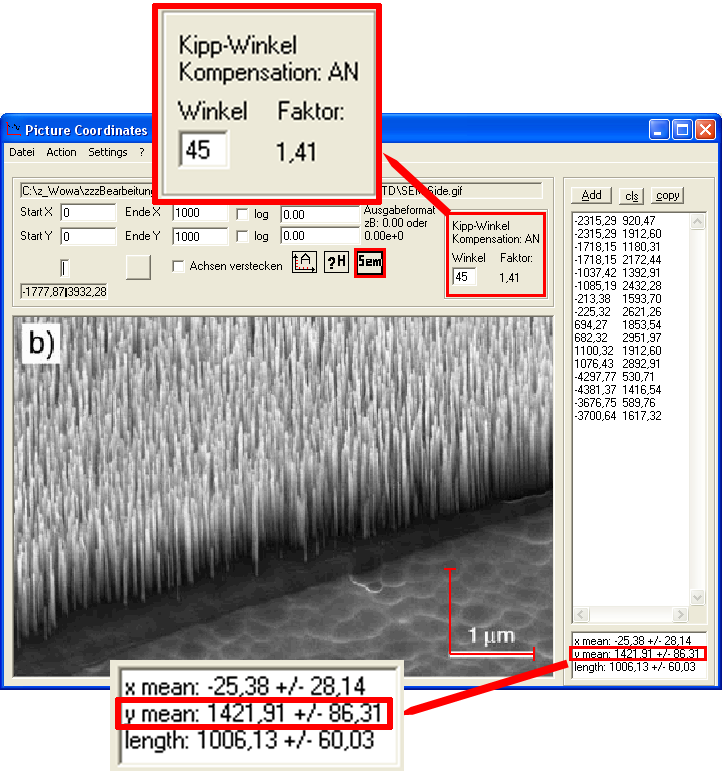
SEM Mode
Having an SEM image of a tilted sample with let's say an etched structure such as as nanowire or a mesa structure, you are able to precisely determine the real (not projected) height of it. By specifying the tilting angle, the tilt compensation factor is calculated and applied, to give you the right value to determine the height of a structure.
With Digitize Plot To Data it is possible to obtain the height of this etched diamond nanowires (picture: W. Smirnov [1]) The real length is roughely 1.42 µm. Without tilting angle compensation, you would obtain the projected and much smaller value of ca. 1.00 µm.

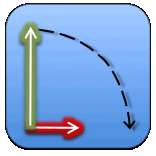
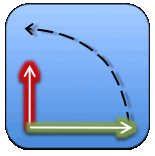
 icon, the program expects two clicks from you: the upper most point of the y-axis and the right most point of the x-axis: